When developing a process or implementing a new one it is difficult to tell if the change has helped. Here is a tool to be able to determine more from collected data and to make more informed decisions. These tools can be used for evaluating accounting data, insurance data, and many more areas in a practice.
Common cause variation refers to the inherent and predictable variation present in a stable process. These variations are expected and natural, representing the ongoing and consistent fluctuations within the system. Common cause variations can be quantified and typically require significant process alterations to change. Examples of common cause variations include slight variations in task completion time, normal wear and tear, computer lag time, and measurement errors.
The benefits of common cause variation lies in its measurability and establishment of a baseline.
On the other hand, special cause variation refers to unexpected and significant events that disrupt a process. Special cause variations are typically triggered by specific changes in the process, leading to measurable fluctuations in data.
The benefits of special cause variation lies in its potential for identification and addressing.
The main difference between common cause variation and special cause variation are in their nature and impact on the process. Common cause variations are normal and expected, reflecting a stable process, while special cause variations indicates an unstable process due to unexpected and significant variations caused by specific changes.
Understanding both types of variation are crucial in management as it enables monitoring and evaluation of a processes performance. By analyzing charts and distinguishing between common cause and special cause variations, managers can determine process stability and make appropriate adjustments.
Here are four factors in determining if your process is recognizing common or special cause variation.
- Shifts: A Shift occurs when six or more consecutive data points are above or below the median.
- Trend: A Trend occurs when five or more consecutive points all increase or decrease.
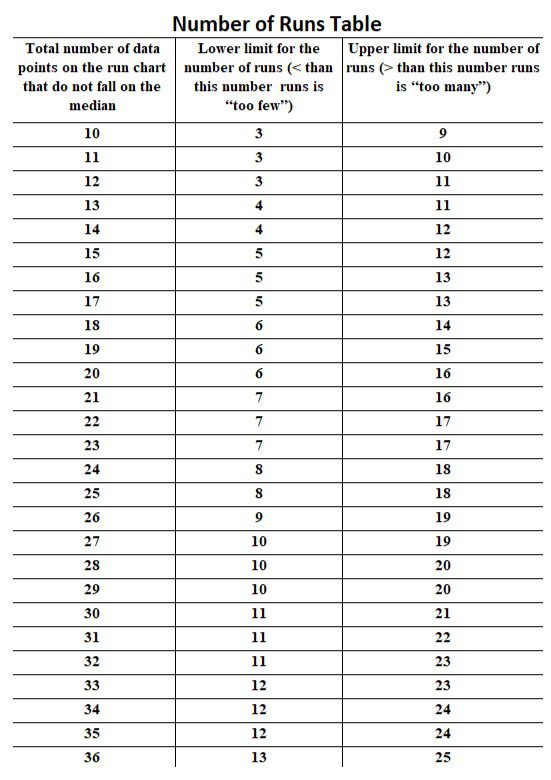
- Number of Runs: Having too many or two few runs in a chart. Runs are the points either above or below the median. This is determined by a mathematical formula. See Figure 6.
- Astronomical Data Point: A Data point that appears far away from the median.
In figure 1, there is a stable run chart meaning there is only common cause variation. With EyeAppoint Optometry’s revenue being stable, it is able to institute projects or changes to increase revenue and effectively analyze if it is being successful.
Here are examples of how you could have special cause variation.
- In figure 2, from May to October there are six data points above the median meaning there was a shift in the chart and special cause variation. If EyeAppoint Optometry changed a process in May and recognized this shift it would indicate a successful process that increased revenue. A practice would want to continue to track data to see if the adjustment was for long term benefit.
- In figure 3, from March to August there are five data points increasing meaning there was a trend in the chart and special cause variation. If EyeAppoint Optometry changed a process in March and recognized this trend it would indicate a successful process that increased revenue. A practice would want to continue to track data to see if the adjustment was for long term benefit.
- In figure 4, the graph has 12 runs throughout the year meaning that each data point switches back and forth from above or below the median revenue. According to the runs table 11 is the maximum number of runs for 12 data points meaning there is special cause variation. If EyeAppoint Optometry had this occurring they would need to evaluate what could be causing the constant changes in revenue and implement adjustments to stabilize the data.
- In figure 5, the graph has a data point that is far different from the other data meaning there is an astronomical data point and special cause variation. If EyeAppoint Optometry had this occur then something major happened and evaluation is needed.
When you have a stable process and want to become better you can introduce new processes, technology, or ideas to produce the desired changes.
EyeAppoint can help! Increase google reviews and ratings with our local maps and reputation services or increase patients scheduling by offering online booking options. View our services to see how we can help you!
Figure 1
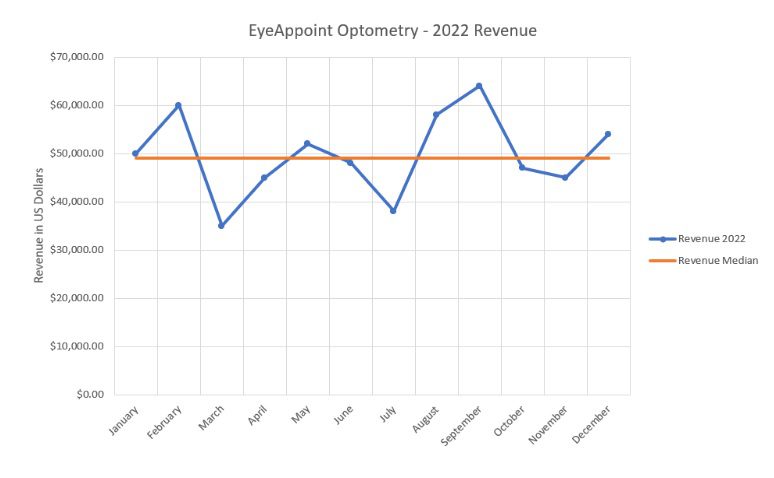
Figure 2
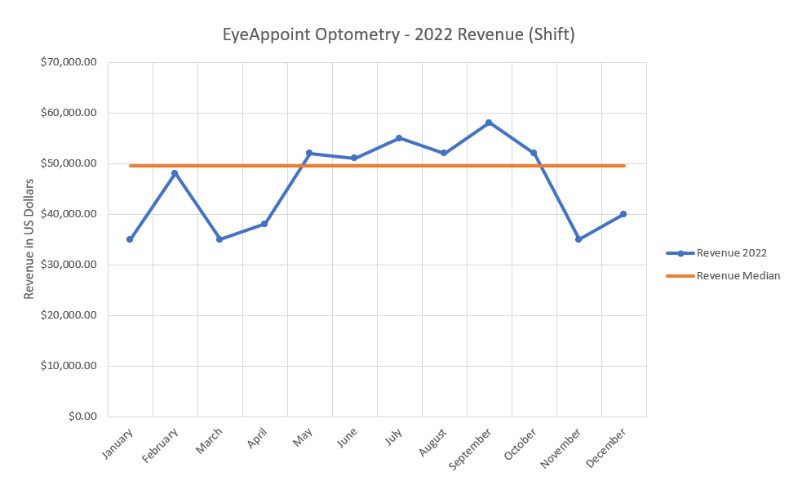
Figure 3
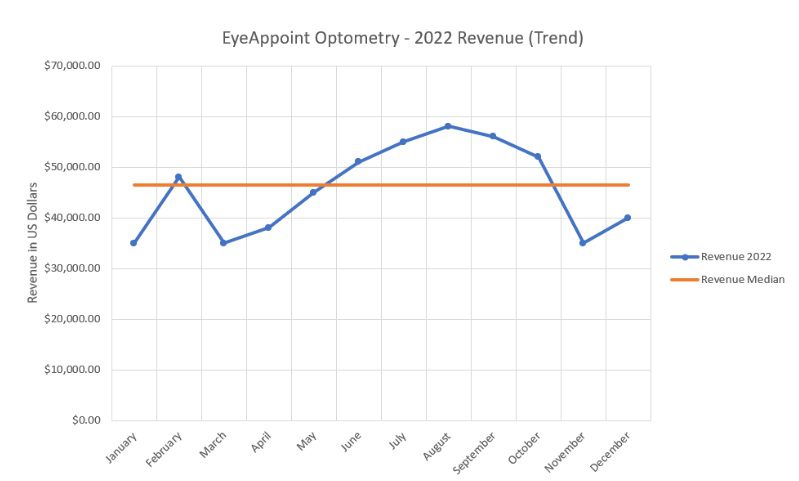
Figure 4
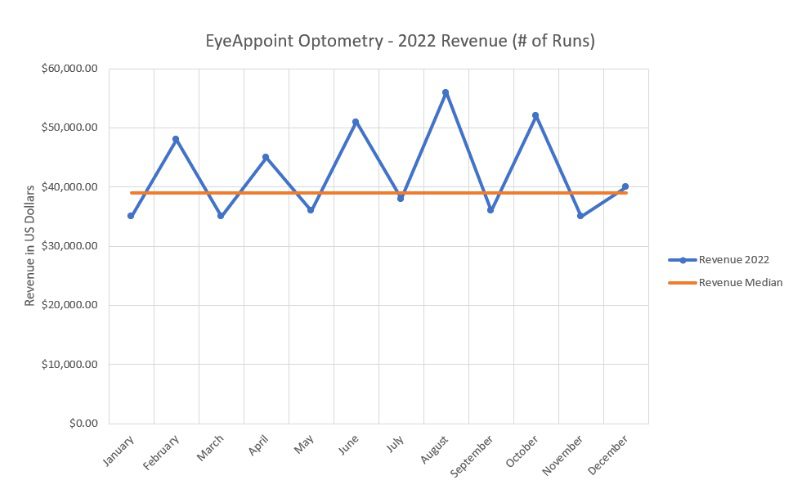
Figure 5
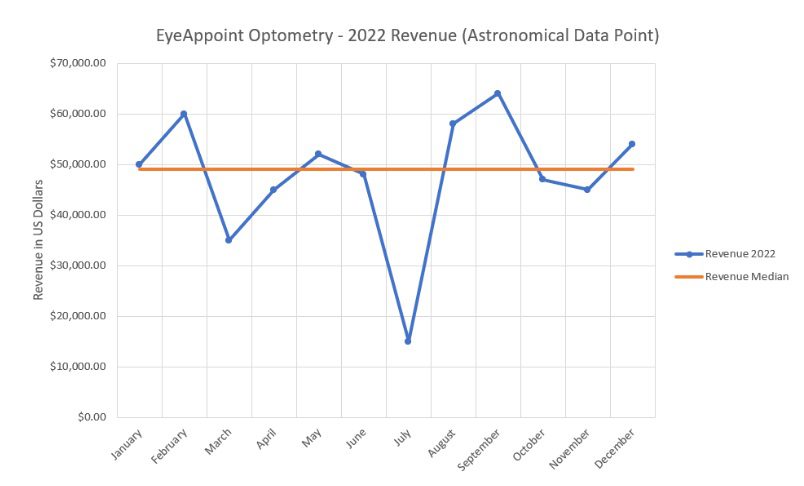
Figure 6